🔋
State of charge
An estimate of the remaining capacity, expressed as a percentage. More useful than voltage alone on a LiFePO₄ battery.
 WEATHER ↗A–Z
This original guide is now the centrepiece of a complete technical library. Take a chapter at a time, investigate your actual data, then use the tools to plan a real night away.
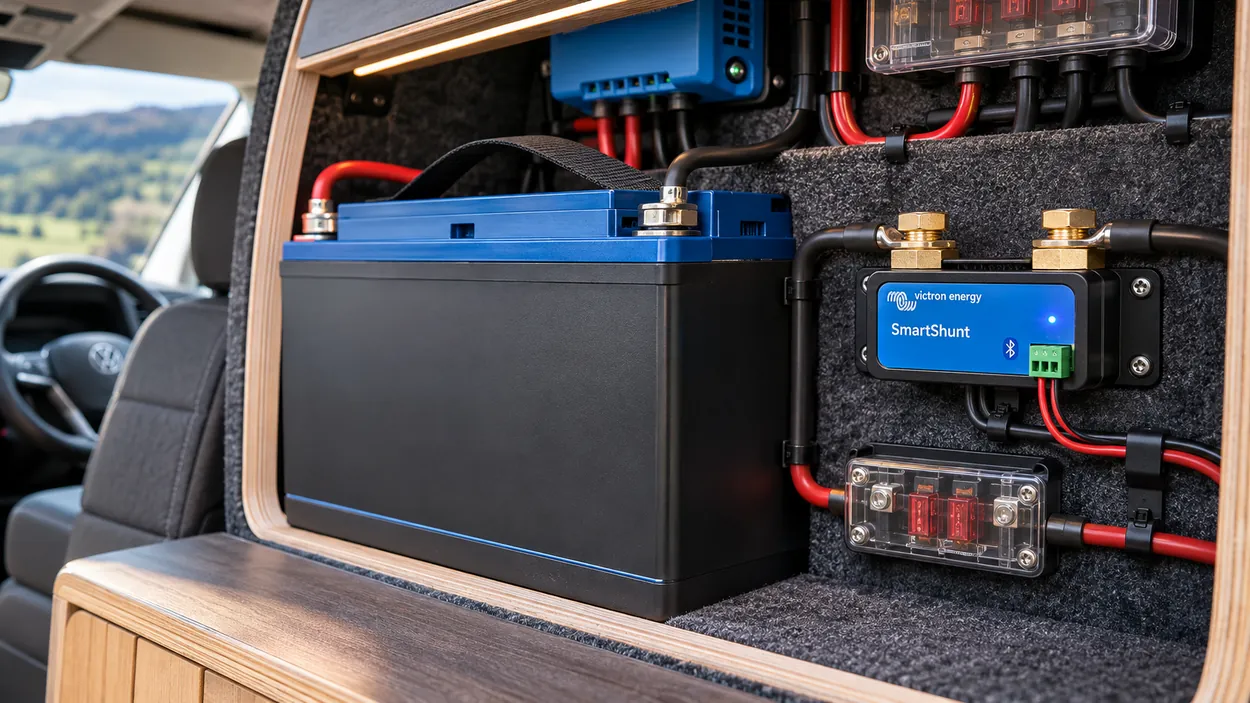
A proper battery fuel gauge, 37 days of real-world records, and the story of how Vanilla uses her off-grid electricity.
There's something rather satisfying about parking Vanilla up somewhere scenic, putting the kettle on and knowing the electrics are under control. But the important question is simple: how much battery power do I actually have left?
The Victron SmartShunt sits in the leisure battery's negative connection and measures the electricity going into and out of it. VictronConnect uses that information to estimate state of charge, consumed amp-hours and the time remaining at the current load.
Think of it as a fuel gauge. It isn't a charger or a battery management system. It is the instrument that tells you what the battery is doing.

An estimate of the remaining capacity, expressed as a percentage. More useful than voltage alone on a LiFePO₄ battery.
Real-time amps and watts moving into or out of the battery. Positive means charging; negative means discharging.
Watch battery cycles, depth of discharge, consumption and full-charge history. The evidence behind your off-grid decisions.
I've added a little NIX battery cinema to this guide: an original animated story of Vanilla's readings, followed by three properly relevant tutorials on the SmartShunt, installation and state-of-charge synchronisation.
Watch Vanilla's state of charge change across the log, including that dip into the low thirties and the subsequent recoveries. It's made directly from the figures you supplied — no invented voltages or pretend charging currents.
Use the interactive real-data chart below to explore the same period more closely.
Tap a video to load its YouTube player. Playback needs internet access; the video links are always available as a backup.
A practical UK retailer's overview of the standard SmartShunt and its basic installation. Watch this alongside the wiring explanation, not instead of the manufacturer's instructions.
Open on YouTube ↗Victron explains how to install, connect and configure the IP65 version. The monitoring principles transfer to the standard SmartShunt, but confirm model-specific details before touching any wiring.
Open on YouTube ↗Linked from Victron's SmartShunt manual, this explains charged voltage, tail current and timing. It uses the BMV monitor family to teach principles that also apply to SmartShunt.
Open on YouTube ↗All three tutorials are third-party or manufacturer content, credited to their creators. They are not filmed by NIX; the animated battery history above is a newly made original from your uploaded CSV. If YouTube blocks embedded playback, use each “Open on YouTube” link.
Vanilla uses a 105Ah lithium leisure battery, solar charging, a DC–DC alternator charger and a mains charger. Her SmartShunt reports the net effect on the battery, after whatever loads and chargers happen to be working.
| Battery | Fogstar Drift 105Ah LiFePO₄ |
|---|---|
| Battery monitor | Victron SmartShunt |
| Solar panel | PV Logic 200W rigid panel |
| Solar controller | Victron SmartSolar MPPT 75/15 |
| Vehicle charging | Victron Orion 12/12–30A DC–DC |
| Mains charging | Victron Blue Smart IP65 25A |
| Distribution | Sargent EC155 |
| Typical loads | 50L fridge, Webasto heater controls/fan, lights and accessories |
Concept only: All relevant load and charger negative return paths must pass through the shunt. Use the official manual and a qualified installer for real electrical work. This is not a wiring specification.
This is the difference between a generic battery guide and the NIX version. Every point in the following charts comes from the supplied Solar System Charge and SOC Data.csv.
A reading was recorded at each of 888 valid hourly timestamps. The export has 24 blank records (four at the beginning and twenty at the end). The latest measured value is 12 November at 03:00, not the nominal end of the file.
Median of 888 values. This describes the log, not measured battery health or usable capacity.
Ah in the export at 08:00 on 30 October. Source of charging not identified.
Ah in the export at 18:00 on 9 October. Not a measured instantaneous amp reading.
Select an actual episode. Orange traces are SOC; green and blue bars display the signed exported Charge (Ah) entries.
Chart bars are proportional to the largest absolute signed Ah entry in this selected period, not drawn on the SOC percentage axis.
At 14:00 on 20 October, SOC was 97.1%. By 09:00 on 21 October it had reached the record low of 32.1%, a fall of 65.0 percentage points. Within the same day, the reported SOC rose to 98.8% at 15:00. The export confirms the behaviour, not which charger or appliances caused it.
SOC was 80.5% at 00:00 on 3 November, reached 37.0% at 08:00 on 5 November, then climbed to 83.8% by 14:00. That's a 46.8-point recovery in six hours. The file records large positive Charge (Ah) entries during that charging period, but it does not distinguish solar from alternator or mains charging.
The recorded SOC was 63.2% at 09:00, 79.6% at 10:00, 94.2% at 11:00 and 100% at 12:00. This is consistent with a powerful charging episode and potentially a full-charge synchronisation, but the CSV alone cannot verify either the charging source or the accuracy of that 100% reset.
Grouping the 888 signed Charge (Ah) values by hour gives a useful picture. Positive values cluster most strongly in late morning; overnight averages tend to be negative.
That's consistent with a campervan that uses electricity all night and often receives charging during the day. It is not proof of the 200W solar panel's output: the alternator and mains charger may also have contributed.
Because the file identifies the values as Ah, I have not relabelled these as actual amps or watts. You would need the underlying measurement definition and, ideally, charger-specific data to calculate reliable generation totals.
Averages include all valid dates and all charging sources; this is not a standalone solar yield chart.
The estimated fraction of nominal capacity remaining. For a 105Ah battery, 76% corresponds to roughly 79.8Ah nominal charge-equivalent if the monitor is calibrated. It isn't a fresh capacity measurement.
Positive is net battery charging; negative is net discharging. This is instantaneous current displayed by the app, and must not be confused with the CSV's Ah column.
Helpful for checking operating voltage, but a lithium battery's fairly flat voltage curve makes it a poor standalone gauge of state of charge.
Volts × amps. A 13V battery supplying 5A is providing about 65W at that moment.
A moving estimate based on present and recent load, plus the configured discharge floor. It changes when the fridge cycles or charging begins.
SmartSolar reports what your panel/controller is producing. SmartShunt reports the net current at the battery. The readings don't need to be the same.
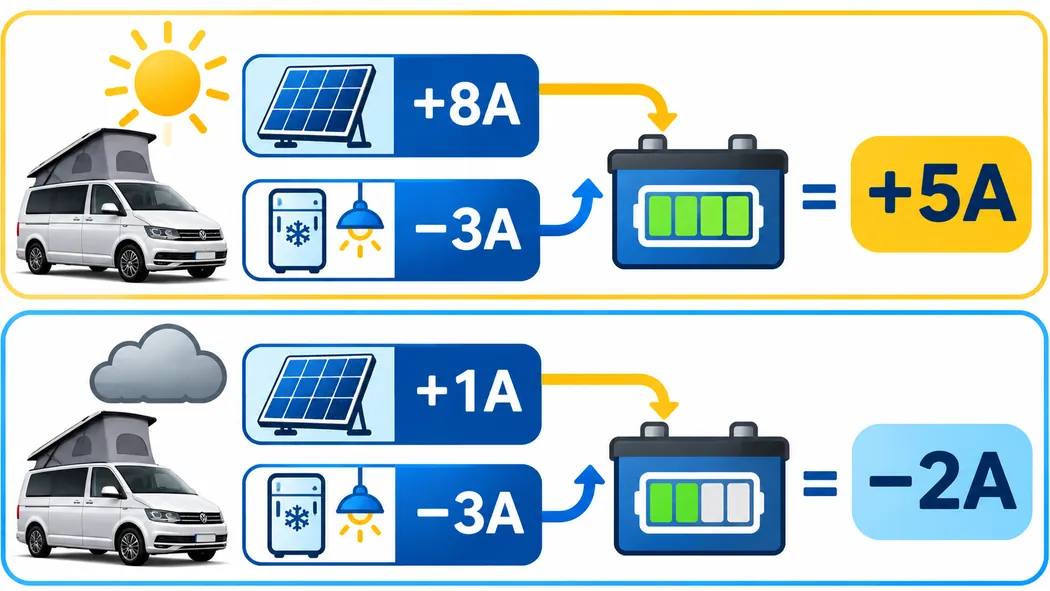
The battery receives 5A net. SmartShunt shows charging.
The battery supplies the missing 2A. Solar is still working; the battery just isn't receiving enough to charge.
Move the sliders to see how changing solar production and appliance loads alters the current entering or leaving a battery.
It's deliberately simple: it ignores wiring loss, charger conversion loss, battery limits and charging stages. The purpose is to make the idea of net current instantly clear.
Ah versus A: One amp sustained for one hour is one amp-hour (1Ah). Your CSV has Ah readings, so don't call its +20.73 Ah entry “+20.73A” without verifying the export's time aggregation.
These are practical lithium starting points, not a claim that I've inspected the settings on Vanilla's phone. Before changing anything, verify the exact battery, firmware, absorption voltage and manufacturer's advice.
| Battery capacity | 105Ah — Vanilla's fitted battery |
|---|---|
| Charged voltage | 13.9V — Victron's general 12V lithium starting point; Fogstar advises 14.2V. Must suit your charger and synchronisation behaviour. |
| Tail current | 4% (4.2A) — general starting point; Fogstar's published pages contain differing guidance, including 1% elsewhere. |
| Charged detection time | 3 minutes — Victron default |
| Peukert exponent | 1.01 unless battery manufacturer specifies otherwise |
| Charge efficiency | 98% Victron generic lithium; Fogstar cites 99% |
| Discharge floor | 10% as a practical time-to-go planning reserve. Fogstar's published figure is 0%. |
“Charged voltage” on a SmartShunt is a condition used to decide when to reset the monitor's SOC estimate to 100%. It does not tell the MPPT, Orion or mains charger what voltage to output.
Fogstar's usual charger recommendations include around 14.2V absorption and 13.5V float, subject to the exact battery documentation. Those settings live on the chargers.
The SmartShunt synchronises only when charged-voltage, tail-current and detection-time conditions are satisfied together.
References: Victron SmartShunt configuration, settings manual, and Fogstar Drift Q&A. Fogstar's different support pages are not entirely consistent on all SmartShunt-specific values, so treat these as reviewed starting points.
Loads or chargers connected directly to battery-negative bypass the monitor, making its current and SOC estimate incomplete.
Manually syncing to 100% before a verified full charge starts a potentially inaccurate estimate. Let the correctly set monitor synchronise.
If the monitor is configured for 100Ah or 200Ah instead of Vanilla's 105Ah, consumed-Ah calculations won't translate into the right SOC estimate.
Amps (A) are the present rate of flow. Amp-hours (Ah) are charge integrated over time. Watt-hours add voltage and are a measure of energy.
A compressor fridge, diesel heater and variable sunlight make the estimate bounce around. Use it as planning advice, not a deadline.
A 100% SOC reading doesn't prove the battery still holds 105Ah. Proper capacity/health testing needs more controlled measurements.
Open VictronConnect. Check the SmartShunt is connected and reporting correctly.
Read state of charge, consumed Ah and net current. These tell a better story together than any one number alone.
Compare the SmartSolar's production with the SmartShunt's net battery reading.
Check the forecast and planned loads, particularly the fridge and diesel heater electrical demand.
If the percentage looks suspicious, look at the wiring and synchronisation settings instead of blindly pressing “100%”.
Lowest observed SOC. A real reminder that a battery percentage can move quickly when demand exceeds replenishment.
Battery recovered from 37.0% that morning. One of the best case studies in the log.
A full reading after a rapid recovery, but the log alone doesn't certify correct synchronisation.
The latest measured SOC in the supplied file. The remaining rows are placeholders, not new measurements.

The SmartShunt doesn't make electricity. It does something arguably more useful: it gives you the information to use the electricity you've got. And when you can stop worrying about the battery, you can spend a little more time enjoying the view.
NIX Drones · Campervan Tech · Real Data · Better Adventures
The SmartShunt can display readings to fine decimal places, but that does not make every SOC estimate exact. A bypassed negative connection, incorrect battery capacity, incomplete synchronisation or mismatched logged timestamps can lead to apparently convincing but misleading numbers.
Battery-side voltage and current through its shunt. From that it calculates SOC, consumed Ah, time to go and history.
Verified solar yield, energy in kWh, precise charger source, individual fridge usage or battery cell health. We need more sensors or logs for those claims.
Read the case-by-case field analysis, try the overnight calculator and test yourself with the 15-question NIX quiz.
The SmartShunt can display readings to fine decimal places, but that does not make every SOC estimate exact. A bypassed negative connection, incorrect battery capacity, incomplete synchronisation or mismatched logged timestamps can lead to apparently convincing but misleading numbers.
Battery-side voltage and current through its shunt. From that it calculates SOC, consumed Ah, time to go and history.
Verified solar yield, energy in kWh, precise charger source, individual fridge usage or battery cell health. We need more sensors or logs for those claims.
Read the case-by-case field analysis, try the overnight calculator and test yourself with the 15-question NIX quiz.